Rating by Style
Background Introduction
In this Ramen dataset, there are 8 ramen packaging styles. We wonder if different packaging styles may affect the rating of ramen by Hans - similar to that coke in can is always better than coke in plastic bottle. In the following adventure, let’s see if the packaging style makes a difference!
Counts of Ramens by Style
Now let’s check the counts of ramens included in each style.
We see that the style of mast varieties rated is Pack, with 1531 varieties rated in the dataset. Since there are too few ramen varieties in Bar (1), Can ((1)), and Box (6), we’ll exclude these styles in the following analysis.
Distribution of Rating by Style
Then, let’s take a look at the distribution of ramen rating by packaging style. 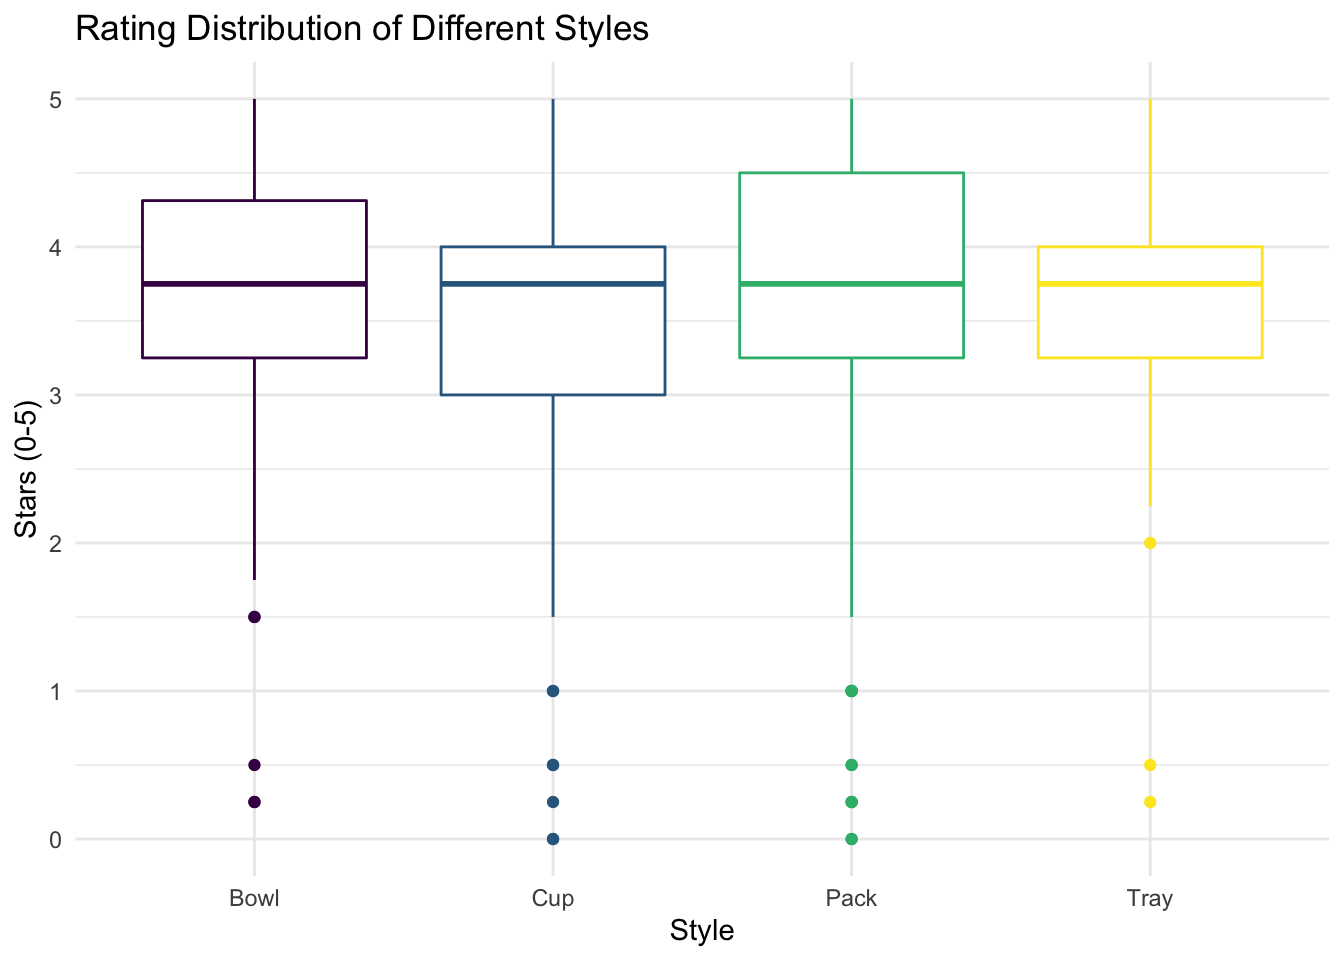
According to the box plot, we can see that most ramens in the four styles have rating scores higher than 3 stars out of 5. The medians of stars for Bowl, Cup, Pack, and Tray ramens are similar (around 3.7 stars). Among the four styles, generally, bowl ramens tend to have higher rating scores comparing to others, while cup ramens seem to have lower rating scores, despite that pack ramens have the most outliers with low rating scores.
Linear Model
We would love to know if the differences in rating scores are significant across these four styles. To do this, we decided to fit a linear model with stars as an outcome depending on style.
Model Fitting
| term | estimate | p.value |
|---|---|---|
| (Intercept) | 3.649 | 0.000 |
| Style: Cup | -0.186 | 0.175 |
| Style: Pack | 0.052 | 0.633 |
| Style: Tray | -0.265 | 0.229 |
From the results (reference category: Bowl), we can see that the rating scores are not statistically significantly different across these 4 styles at a significant level of 0.05.
Model Diagnostics
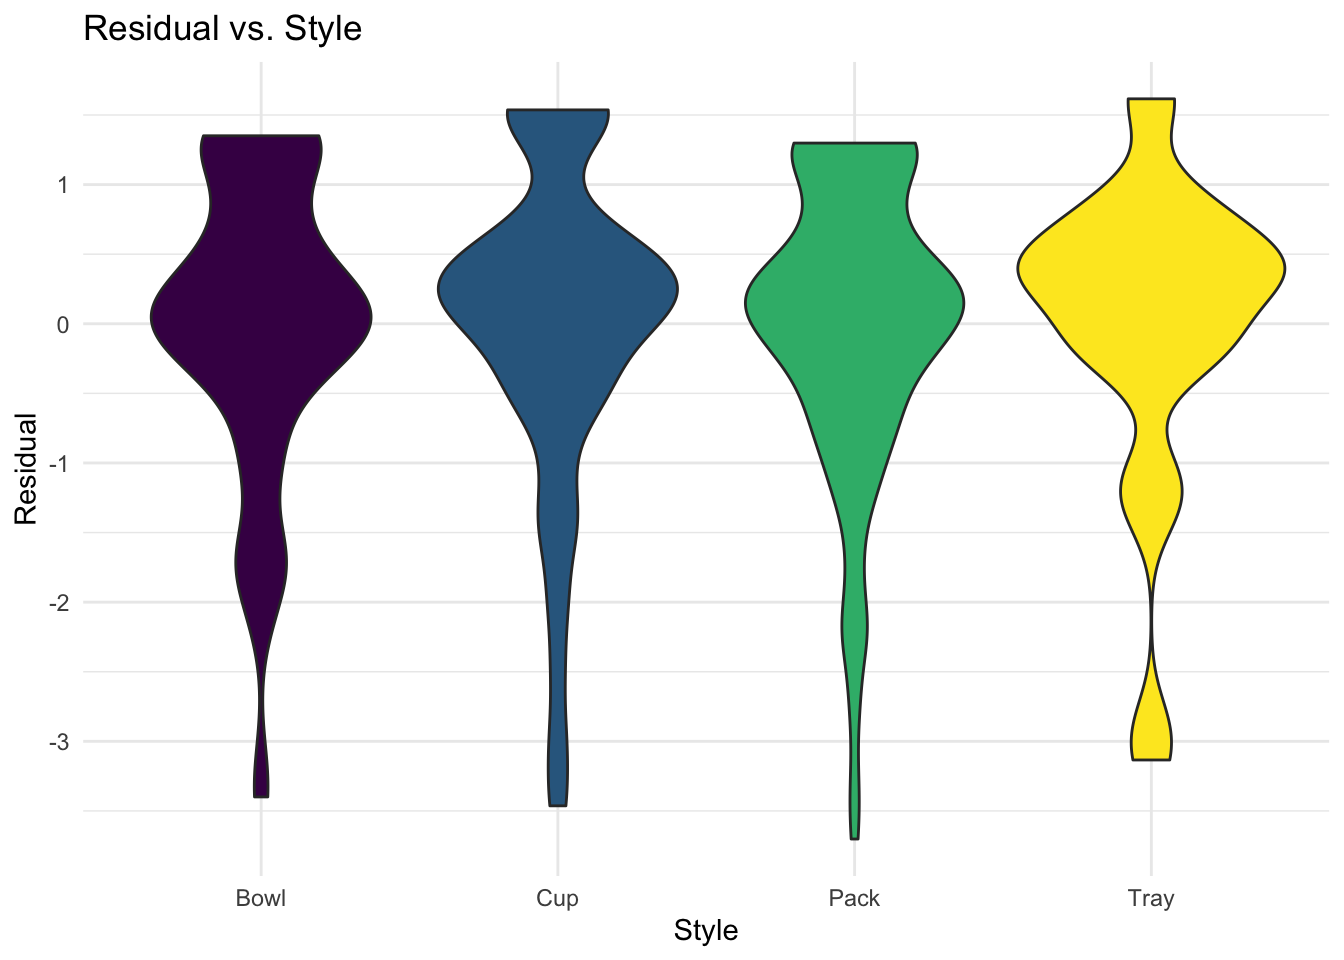
The reasons for the violation may include:
- The dataset of ramen varieties is actually not a random sample from all varieties all over the world.
- The underlying distribution of ramen ratings is probably not normal, since the ratings were just based on the rater’s personal preference.